Debugging Tool
Master Combat Core provides a built-in visual graph debugging tool to make debugging clearer, faster, and far less painful.
Visual Graph Debug Mode
-
Open your GraphObject in the Visual Graph Editor.
-
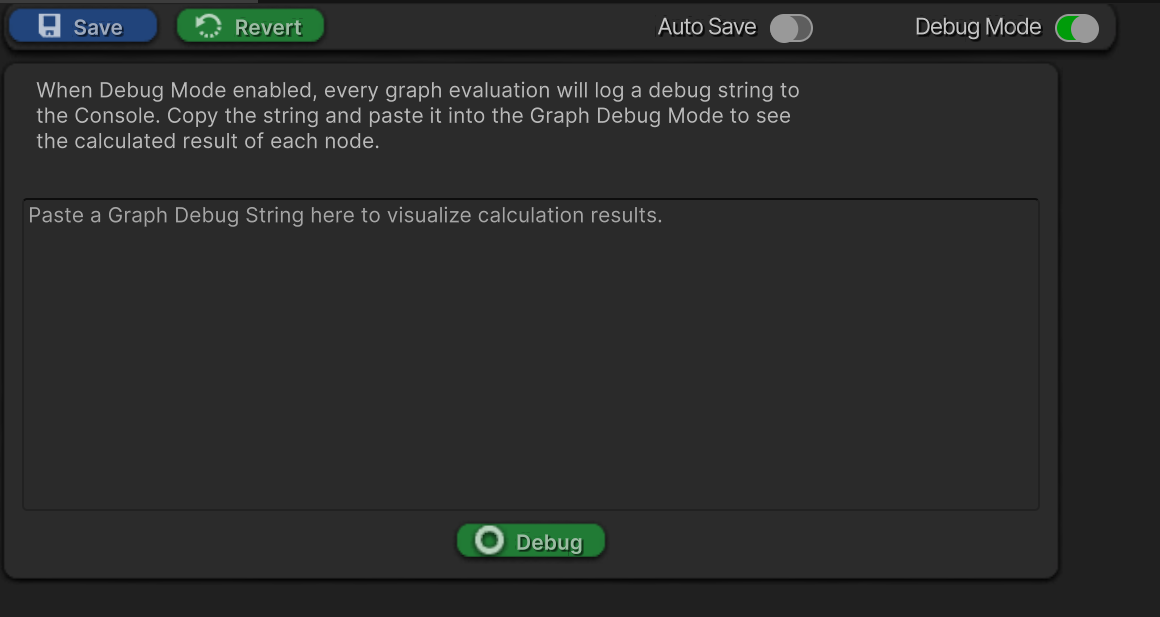
Toggle Debug Mode in the top-left toolbar.
-
Enter Play Mode and trigger the combat or behavior you want to debug.
-
A long debug string will appear in the Console.
-
Pause/Stop the game.
-
Copy the debug string and paste it into the text field below the Debug Mode button.
-
Click Debug.
Each node in the graph will now display its runtime calculation result, allowing you to clearly see:
-
Which nodes executed
-
What values were calculated
-
Where logic passed or failed
This makes it easy to trace complex logic without stepping through code.
Runtime Log Debugging
In addition to visual debugging, Master Combat Core also provides multi-level runtime logging.
To configure log output:
- Go to:
Project Settings > SoftKitty
- Adjust the Debug Level slider to control how much information is printed to the Console.
Available levels range from minimal output to detailed runtime logs.
Note:
The default Debug Level is set to None to avoid unnecessary console noise.
Summary
-
Visual Debug Mode shows node-by-node runtime results
-
Runtime logs provide traditional console-based debugging
-
Both systems can be used together for maximum clarity